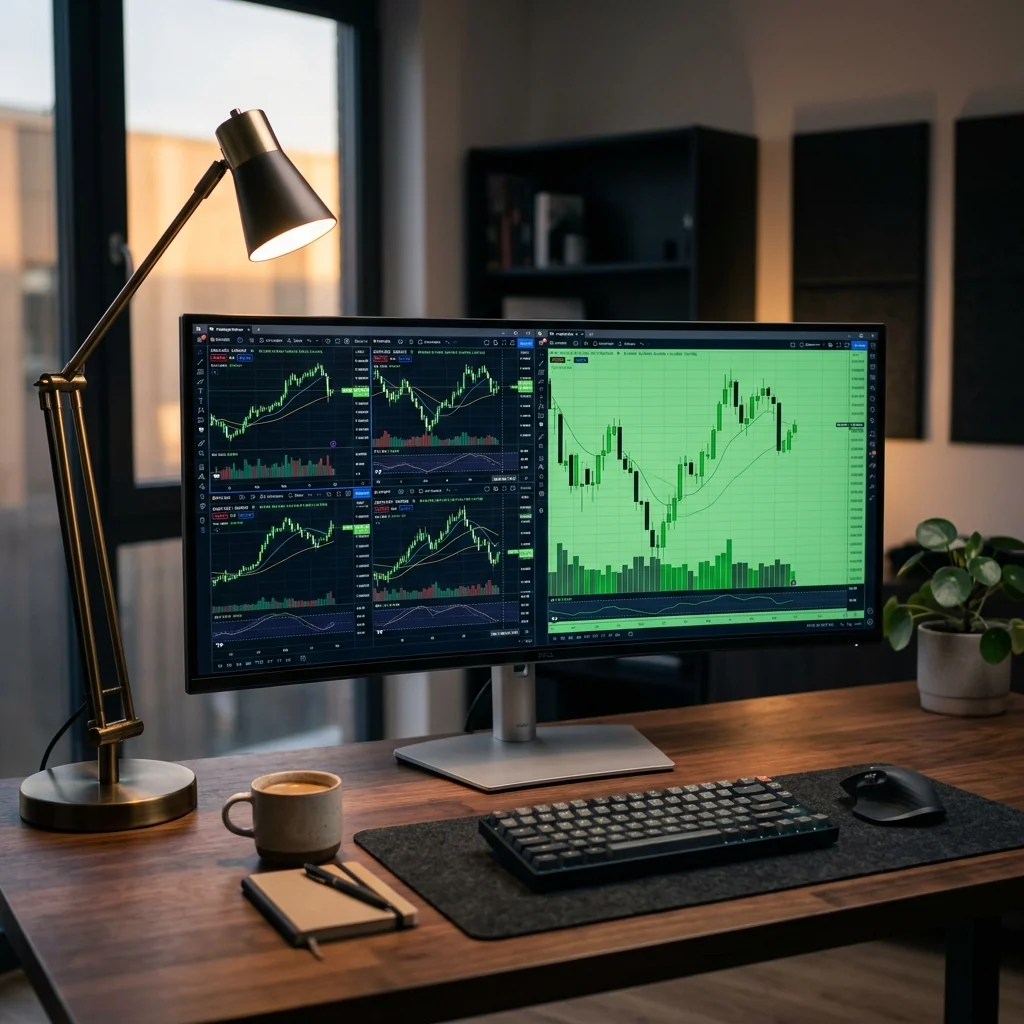
What Is Price Action?
Price action is the study of raw price movement on a chart — without relying on lagging indicators like moving averages, RSI, or MACD. Instead of waiting for a calculated signal, price action traders read the story that the market is telling through candlestick patterns, support and resistance levels, and the structure of highs and lows.
At its core, price action trading is about understanding the psychology behind every candle on the chart. Every price bar represents a battle between buyers and sellers — and the shape, size, and position of that bar tells you who is winning, who is losing, and where the balance of power might shift.
Professional traders at institutional firms, hedge funds, and proprietary trading desks often rely on price action as their primary decision-making framework. The reason is simple: price is the only indicator that never lags. Every other technical indicator is derived from price — making price itself the most direct source of market information.
Why Professional Traders Use Price Action
The advantages of price action trading over indicator-based strategies are significant:
- Speed of decision-making — You react to what the market is doing right now, not what it did 14 or 26 periods ago
- Adaptability across timeframes — The same patterns work on a 1-minute chart and a weekly chart
- Reduced chart clutter — Fewer indicators means clearer thinking and fewer conflicting signals
- Universal application — Price action works on EUR/USD, GBP/JPY, or any currency pair with sufficient liquidity
At Kaia Systems, our analytical methodology is built on a price action foundation. We combine raw chart reading with order flow analysis and volume profiling to create a multi-dimensional view of the market that goes beyond simple candlestick patterns.
The 5 Core Concepts of Price Action
1. Support and Resistance
Support and resistance are the building blocks of all price action analysis. Support is a price level where buying pressure historically exceeds selling pressure, causing price to bounce upward. Resistance is the opposite — a level where sellers consistently overpower buyers. These levels are not exact prices but rather zones where the market has repeatedly shown a reaction. The more times a level is tested, the more significant it becomes — but also the more likely it is to eventually break.
2. Candlestick Patterns
Candlestick patterns are the visual language of price action. A single candlestick tells you four pieces of information: where the market opened, where it closed, and how high and low it traveled during that time period. Key patterns include the pin bar (a long wick showing rejection of a price level), the engulfing pattern (a large candle that completely covers the previous candle, signaling a shift in momentum), and inside bars (a candle that forms entirely within the range of the previous candle, indicating consolidation before a breakout).
3. Market Structure
Market structure refers to the pattern of higher highs and higher lows (uptrend) or lower highs and lower lows (downtrend). Understanding market structure is essential because it tells you the dominant direction of the market. Trading with the structure — buying during uptrends and selling during downtrends — dramatically increases your probability of success. A break in market structure, such as a lower low in an uptrend, is one of the earliest signals that a trend may be reversing.
4. Trend Lines and Channels
Trend lines connect swing lows in an uptrend or swing highs in a downtrend, creating a visual reference for the market's trajectory. When two parallel trend lines contain price movement, they form a channel. Channels are powerful because they give you clearly defined areas to look for entries (at the lower boundary in an uptrend channel) and exits (at the upper boundary). A break of the channel boundary often signals acceleration or reversal of the trend.
5. Liquidity and Stop Hunts
Advanced price action traders understand that the market moves toward liquidity. Stop losses from retail traders create pools of liquidity above resistance and below support. Institutional players — banks, hedge funds, and market makers — often push price into these liquidity pools to fill their large orders before the real move begins. This is why you frequently see price spike beyond a key level, trigger stop losses, and then reverse sharply. Understanding this dynamic is what separates professional price action analysis from basic chart reading.
How to Get Started with Price Action
If you are new to price action trading, here is a practical roadmap to build your skills systematically:
- Start with higher timeframes. The daily and 4-hour charts produce the cleanest price action signals because they filter out the noise of lower timeframes. Begin your analysis here before looking at anything below.
- Learn to identify key levels. Before looking at any candlestick pattern, mark the major support and resistance zones on your chart. These levels provide the context that gives individual candles their meaning.
- Focus on fewer patterns. Master two or three high-probability patterns — such as pin bars at key levels, engulfing patterns at support/resistance, and inside bar breakouts — before expanding your repertoire.
- Keep a trading journal. Document every setup you take with screenshots, your reasoning, and the outcome. Over time, this journal becomes your most valuable learning tool.
- Practice risk management first. Even the best price action setup will produce losing trades. Professional traders limit risk to 1-2% of their account per trade and focus on asymmetric risk-to-reward ratios where the potential gain is at least twice the potential loss.
Common Mistakes to Avoid
The most frequent mistake new price action traders make is trading patterns in isolation — seeing a pin bar on a random part of the chart and taking the trade without considering the context. A pin bar at a major support level with the trend has a much higher probability than a pin bar floating in the middle of a range.
Another common error is overtrading. Price action traders often feel compelled to trade every signal they see. The discipline to wait for high-quality setups at key levels — and to sit on your hands when the market is not offering clear signals — is what ultimately determines your long-term profitability.
Finally, avoid mixing too many indicators with your price action analysis. If you find yourself adding RSI, Bollinger Bands, and three moving averages to a price action chart, you are defeating the purpose. The beauty of price action is its simplicity — let the chart speak for itself.
The Bottom Line
Price action trading is not a shortcut to profits — it is a skill that requires consistent practice, disciplined risk management, and the patience to wait for high-probability setups. But for traders willing to invest the time, it provides a framework for understanding markets that remains relevant regardless of market conditions, asset class, or timeframe.
At Kaia Systems, our research team applies advanced price action analysis — combined with order flow, volume profiling, and fundamental synthesis — to power our quantitative tools. If you want to learn how institutional-grade analysis can enhance your trading, explore KAIA Backtester or contact our team.
Disclaimer: This article is for educational and informational purposes only. It does not constitute financial or investment advice. Forex and financial markets are highly volatile. Past performance is not indicative of future results. Always conduct your own research and consult a qualified financial advisor before making investment decisions.